In my previous post I started looking at how you can leverage Akka.NET's new Phobos product to start logging actor system metrics to Datadog. In this post I'm going to start taking that a little further by exploring the tracing functionality it offers as well.
Similar to the metrics side, Phobos provides a flexible platform that supports a variety of tracing systems, such as Zipkin, Jaeger, Application Insights, and also the OpenTracing standard. I'm a big fan of OpenTracing, and it just so happens that Datadog's APM solution works well with it, so that's what I'm going with here. Just like with metrics, though, if you wanted to go with a different platform then all you'll need to change is configuration, and your code remains the same.
Setting Up OpenTracing
I'm going to stick with the basic Greeter example I used in the last post here, since for now I really just want to see what we get out of the box. In later posts we'll explore some more interesting actor systems.
Just as a reminder, this is all the actor actually does:
Receive<Greet>(msg =>
    Console.WriteLine($"Hello, {msg.Who}"));
To set up logging to OpenTracing there's only a few quick things that need to be done. First we need these NuGet packages:
- OpenTracing
- Datadog.Trace.OpenTracing
Once those are installed, we can initialize a global tracer in our application prior to setting up the actor system:
var tracer = Datadog.Trace.OpenTracing.OpenTracingTracerFactory.CreateTracer();
GlobalTracer.Register(tracer);
This creates a tracer using Datadog's OpenTracing factory and registers it as the global tracer, which is a static instance. Any traces reported to this tracer will be logged down to the local Datadog agent on the machine.
Finally, just like everything else in Akka.NET we need to add a little bit of HOCON to tell it how to wire up tracing:
phobos {
    tracing {
        provider-type = default
    }
}
By default here it'll look for that global tracer we registered, and if it finds one it'll use that. This is why you'll want to make sure to register it prior to spinning up your actor system.
Initial Traces
Since we didn't really need to do much there to get tracing going, this section is mainly going to be images and an introduction to Datadog's APM interface. Let's see what we've got!
The first area you'll see is a list of services that registered traces:
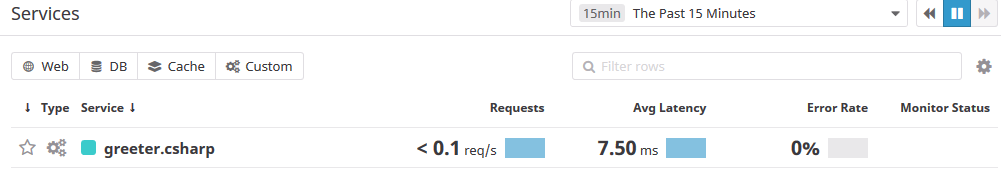
Akka.NET will register a service with a default name based on the application, which in our case becomes greeter-csharp. In this overview you can see a glimpse of average latency, how many requests the service is fulfilling, error rate, etc. This list becomes much more useful when you have a bunch of services, but you have to start somewhere.
Next, let's click through into the service itself and look at its own overview:
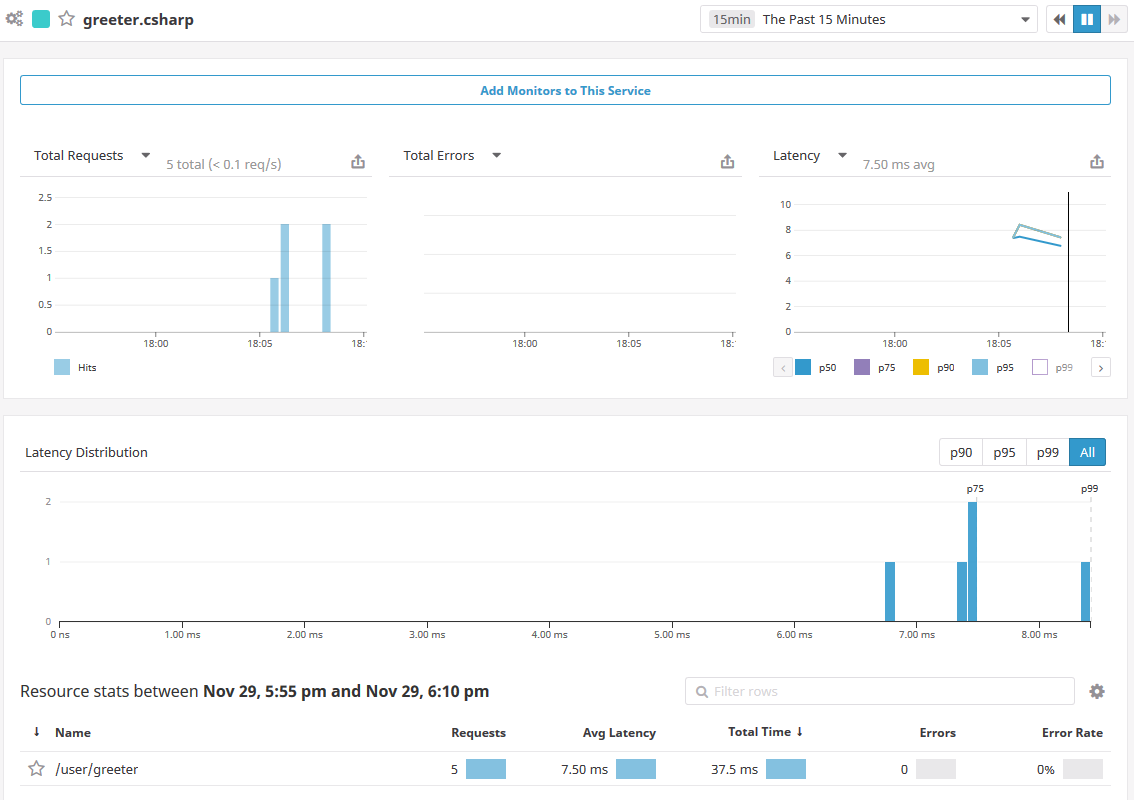
This view gives a nice high level view of how the service is doing, showing the total requests, distribution of their latencies broken into percentiles, and statistics for specific resources within that service. Phobos will create a resource for each actor in your system automatically, so here you can see the /user/greeter actor showing up as a distinct resource here. In a normal actor system you'd have a lot of different actors, so this would allow you to see them broken out individually.
Now let's click through into that actor resource and see its overview. Overall it'll look a lot like the previous screen, except that in the place of the resource list you'll find a list of actual traces that were captured for it:
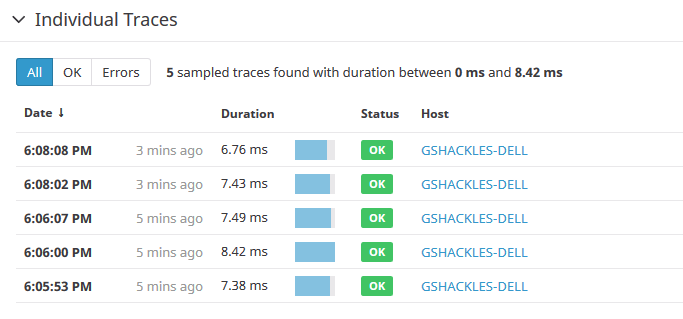
By default Phobos will sample 100% of all traces, but you configure this easily with one line of HOCON if you want to only sample a percentage of messages in your system (which is generally a good idea for production systems).
Now let's click into one of those traces and see what we get:
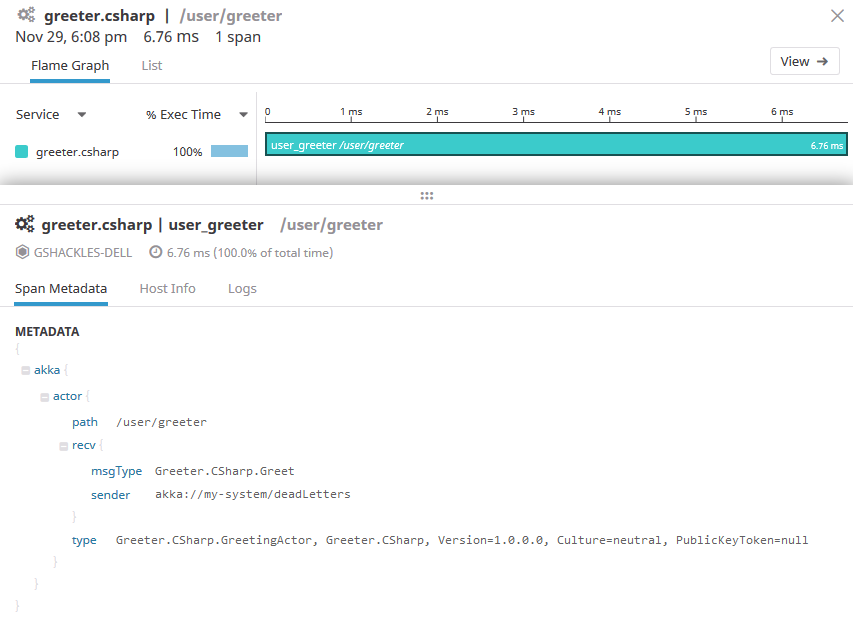
Here you can see a flame graph with one span, which isn't particularly interesting on its own, but you can still see it register the duration of the call into that actor. Below that you can see all the metadata Phobos recorded with the span, which includes things like the actor path, message type, the sender, and more. This information is powerful since later on we can query our traces based on this metadata.
One of the other nice things here is the host info tab, where you can see how the underlying host of that actor was doing at the time of the trace:
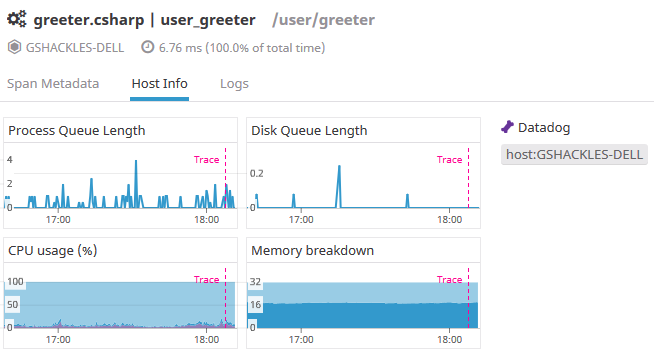
This allows you to correlate things like CPU or memory usage with what your application was actually doing at the time, which is also quite powerful.
Getting Deeper
That's a glimpse of what you get effectively for free - we didn't have to make any changes to our actors and we got all that great information - but that still only goes so far. What if we want to layer in some more information?
Tags
In that initial trace we talked about the default metadata that Phobos provides for the trace. One of the nice things about that metadata is you can easily pile on your own data as well.
If you're familiar with most time-series databases (Datadog included), you're probably just as frustrated as I am about the inability to include high-cardinality fields in your metrics. That's still frustrating, but one awesome thing about Datadog's APM offering is that they offer infinite cardinality for tags there so you can tack on any information that's valuable to you. That's huge!
First, we'll want to get a reference to the Phobos actor context in our actor, just like we did in the last post to log custom metrics:
private readonly IPhobosActorContext _instrumentation = Context.GetInstrumentation();
With that in place, we can just add one line to our message handler to log a tag against the currently active span with the contents of the message:
Receive<Greet>(msg =>
{
    _instrumentation.ActiveSpan.SetTag("who", msg.Who);

    Console.WriteLine($"Hello, {msg.Who}");
});
What's nice here is that you don't need to do anything special to keep track of the current span you're operating under - Phobos handles that for you. Now when we look at the trace in Datadog you'll see the new bit of metadata from that tag:
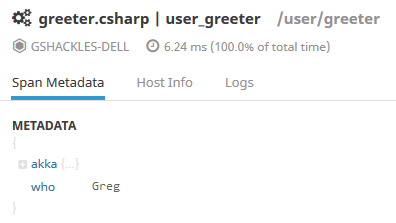
You'll want to be careful not to log sensitive information in these tags, naturally, but this is a really great way to include relevant diagnostic information to your traces to help you understand what your system was doing at that time.
Spans
If you looked at that initial flame graph and found it uninteresting, I'm with you - it's not much of a flame graph with only one span like that. Let's add some more!
Since we're still in this little contrived example of an actor system, let's just add a little bit of code that pretends to do some intermittent work during the message handler:
for (var i = 0; i < 5; i++)
{
    using (_instrumentation.Tracer.BuildSpan("nap-time").WithTag("iteration", i).StartActive())
        System.Threading.Thread.Sleep(100);

    System.Threading.Thread.Sleep(50);
}
Here we loop five times, creating a span each time doing 100ms of "work", tagging each one with the iterator's index, and pausing 50ms between each one. Don't do this in a real app, of course, but let's just pretend these sleeps are network or database calls. Now if we take a look at the flame graph it'll look a bit more interesting:
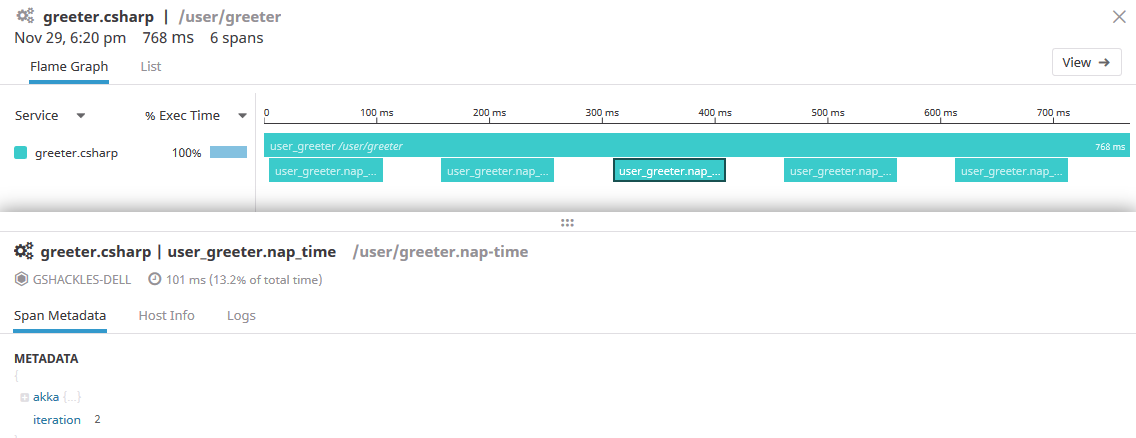
We can see the five nap spans explicitly, each tagged with the data we gave it. Another interesting view that Datadog provides is the list tab, which presents the same data in a different form:
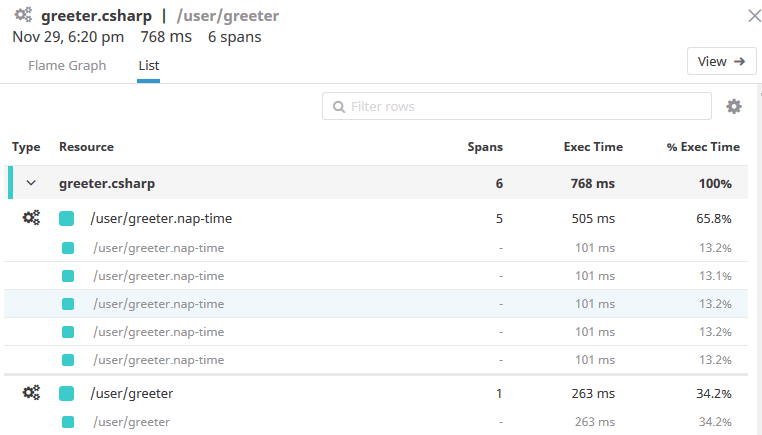
Now we can start to get a better sense of where our actor was spending its time while it was handling the message, and in a nice visual way that doesn't require spelunking through a lot of log files to piece things together.
While this is just the basics of what tracing offers, you can hopefully already see how powerful a tool it can be in really observing how your systems are behaving. That said, this sort of thing is generally referred to as "distributed tracing" for a reason, so in future posts we'll explore what this looks like with multiple actors that communicate with each other like a real system would!