If you're here on my blog, you're probably well aware that I'm a fan of both Akka.NET and Datadog, and observability in general. In fact, I even blogged last year about creating my own Datadog sink for Akka.Monitoring (which is still available on NuGet and we still use it in production every day!).
This scratched some of my itches in terms of getting visibility into my actor systems, but it still fell a little short of what I wanted. For one, it still required adding code like this to my actors:
protected override void PreStart()
{
    Context.IncrementActorCreated();
    base.PreStart();
}
Definitely not the end of the world by any stretch, but still not ideal! It also doesn't play quite as nice with the F# side of things, where I like to define my actors as pure functions instead of using the OO APIs.
Additionally, when building distributed systems it becomes increasingly important to incorporate some sort of distributed tracing into the system to help you diagnose how it's behaving. This was definitely possible before as well, but would again require baking it all myself into all my actors.
Enter Phobos
This is why I got very excited when I saw Petabridge introduce Phobos earlier this year. Phobos aims to provide a stronger out-of-the-box offering around monitoring and distributed tracing, often without needing to make any actual changes to your actor code. Like everything else in Akka.NET, it's highly configurable, and cross-platform as well by nature of .NET Standard 2.0 (in a future post I'll certainly test this in a mobile app!). It also provides integrations into many well-known and established standards like StatsD, Application Insights, OpenTracing, and Zipkin.
Needless to say, this is all very relevant to my interests. As I start to really dig into Phobos and how to integrate it into my Datadog-driven world, I figured I'd try to write up some of my experiences and what it looks like to actually use it.
Metrics
There's a lot of areas to explore, but I figured I'd start with the basics: metrics. Ultimately I'd really love to replace my usage of my NuGet packag mentioned earlier with Phobos, or at least be able to ditch all the custom calls like Context.IncrementActorCreated(). Since Datadog speaks StatsD, that seems like the best place to start.
Default Metrics
Since I really want to see the out-of-the-box experience, I'll start with the simplest actor system in the world and use my Greeter sample application. It contains a single actor that, given a name, echoes out Hello, {name} to the console...clearly the type of problem for which distributed systems were developed.
C#
I'll start with the C# version first, but then we'll check out the F# one to see if things work there too. First I'll need to add a couple new NuGet references to the project:
- Phobos.Actor
- Phobos.Monitoring.StatsD
With those installed, all I need to do is set up the HOCON configuration and use it when spinning up the actor system:
var config = ConfigurationFactory.ParseString(@"
    akka.actor {
        provider = ""Phobos.Actor.PhobosActorRefProvider,Phobos.Actor""
    }

    phobos {
        monitoring {
            provider-type = statsd
            statsd {
                endpoint = 127.0.0.1
                port = 8125
            }
        }
    }");

using (var system = ActorSystem.Create("my-system", config))
Here we specify that the actor provider should be the Phobos one, to use the StatsD monitoring provider, and where to find the StatsD listener. In my case it'll be the local Datadog agent running on the host. There are more options you can configure as well, including which actors you want to opt in/out of monitoring, but we'll just stick with the defaults and monitoring all the things.
Fake StatsD Listener
One thing I like to do when testing StatsD metrics is to set up a little TCP listener on that port that just spits out the messages it receives. StatsD is a dead simple protocol, so it can be a useful way to see what's being reported, as well as a good way to learn how the protocol works. Here's an example Node script I sometimes use to do this:
const dgram = require('dgram');
const server = dgram.createSocket('udp4');

const log = message => console.log(`[${new Date().toUTCString()}] ${message}`);

server.on('message', message => log(message.toString()));
server.on('listening', () => {
    var address = server.address();

    log(`UDP Server listening on ${address.address}:${address.port}`);
});

server.bind(8125, '127.0.0.1');
With that running, let's fire up the actor system and see what we get:
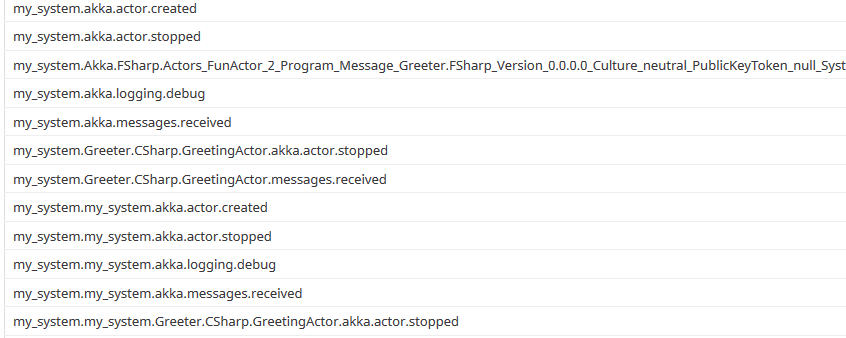
[Wed, 28 Nov 2018 04:33:35 GMT] UDP Server listening on 127.0.0.1:8125
[Wed, 28 Nov 2018 04:33:46 GMT]
my-system.my-system.akka.actor.created:1|c
my-system.akka.actor.created:1|c
my-system.user.greeter.messages.received:1|c
my-system.my-system.user.greeter.messages.received:1|c
my-system.Greeter.CSharp.GreetingActor.messages.received:1|c
my-system.my-system.Greeter.CSharp.GreetingActor.messages.received:1|c
my-system.my-system.akka.messages.received:1|c
my-system.akka.messages.received:1|c
Remember that all we changed was configuration, and not any actor code! Out of the box we got metrics reported for the creation of the system, the actor, and a variety of variants of the messages received. I'll be looking for ways to consolidate this down and make use of tags to clean it up, similar to what I did in my NuGet package, but this is a great start!
F#
Ok, let's try this in F#!
let config = ConfigurationFactory.ParseString("""
    akka.actor {
        provider = "Phobos.Actor.PhobosActorRefProvider,Phobos.Actor"
    }

    phobos {
        monitoring {
            provider-type = statsd
            statsd {
                endpoint = 127.0.0.1
                port = 8125
            }
        }
    }""");

use system = ActorSystem.Create("my-system", config)
This is basically the same code we had in C# - wire up the system using HOCON and we're off to the races:
[Wed, 28 Nov 2018 04:42:22 GMT]
my-system.my-system.akka.actor.created:1|c
my-system.akka.actor.created:1|c
my-system.user.greeter.messages.received:1|c
my-system.my-system.user.greeter.messages.received:1|c
my-system.Akka.FSharp.Actors+FunActor`2[[Program+Message, Greeter.FSharp, Version=0.0.0.0, Culture=neutral, PublicKeyToken=null],[System.Object, System.Private.CoreLib, Version=4.0.0.0, Culture=neutral, PublicKeyToken=7cec85d7bea7798e]].messages.received:1|c
my-system.my-system.akka.messages.received:1|c
my-system.akka.messages.received:1|c
Pretty much the same thing! The amusing exception here is where it tries to create a metric using the actor's class name, which has interesting results for function-based actors :) Either way, it's awesome that the underlying system lit up and started logging these metrics without changing any actor code.
Hook up Datadog
Now that we've got StatsD metrics printing to the console, I'll swap out my little UDP listener with the actual Datadog agent. Nothing has to change in the actor system configuration for this - I just have to turn off the custom listener and start the Datadog service.
Once that's up and running, the metrics start appearing in Datadog as expected and I can start creating alerts and dashboards based on them:
More Metrics
That's what you get by default, but what if you want to sprinkle in some more metric goodness? Let's do that.
Mailbox Length
One of the things I like to have an eye on in my systems is the length of an actor's mailbox, in order to get an indication of whether it's falling behind on processing or something is wrong. Phobos actually makes that dead simple, by exposing it as a configuration property. Just update the monitoring block in the HOCON and you're good to go:
phobos {
    monitoring {
        monitor-mailbox-depth = on
WIth that in place you'll see metrics like these being reported as gauges:
my-system.user.greeter.mailbox.queuelength:0|g
my-system.my-system.user.greeter.mailbox.queuelength:0|g
my-system.my-system.Greeter.CSharp.GreetingActor.mailbox.queuelength:0|g
Custom Metrics
You'll probably also come across situations where you want to log your own custom metrics as well. If you're using something like StatsD you could do that directly through that, but wouldn't it be nicer to be able to log your custom metrics through the same pipeline as the rest of the Phobos metrics?
The story here is a bit better in C# than F#, for similar reasons to the old Akka.Monitoring stuff. What you can do is use an actor's context to get its Phobos context:
private readonly IPhobosActorContext _instrumentation = Context.GetInstrumentation();
Once you have that, you can use its Monitor property to send metrics through the system:
_instrumentation.Monitor.IncrementCounter("awesome-counter", 1);
With that in place you'll see it come through like all the rest of the counters:
my-system.user.greeter.awesome-counter:1|c
my-system.my-system.user.greeter.awesome-counter:1|c
my-system.Greeter.CSharp.GreetingActor.awesome-counter:1|c
my-system.my-system.Greeter.CSharp.GreetingActor.awesome-counter:1|c
The API exposed on IMonitor doesn't currently allow for passing through tags with a metric, but I'm hoping this can be added in future versions. Either way, with that one line of code we've got a custom metric going through Phobos to StatsD and ultimately Datadog. If down the line we wanted to switch to Application Insights or anything else, it would just be a configuration change and everything else would stay the same.
There's a lot more to explore with Phobos, but it's exciting to see this sort of functionality starting to get baked right into the framework (and its supporting packages). In the next post I'll start to look at some of the distributed tracing functionality available in Phobos, and how we can expose that in Datadog's APM tools.