As part of my continued mission to add instrumentation and monitoring into basically everything, Datadog is a tool that I've come to really love. In addition to the built-in metrics it can record, such as things like CPU usage, the real power comes in being able to easily define your own metrics and create meaningful visualizations of the true running state of your systems.
At Olo we run a Hubot instance that connects to our Slack environment. Out of the box Datadog actually already has some nice support for Slack, allowing you to define alerts that get reported into any channel you like. This is great for enabling your system to tell you when something is wrong, but one thing I also wanted to enable was the ability to tap into Datadog on demand from within Slack and make things a bit more bidirectional. How is the CPU usage on our web servers right now? How about the API response times? The more you can tie your tools together the more useful they become, as you lower the friction to taking advantage of them.
hubot-datadog-snapshot
I just open sourced and published to npm a Hubot script named hubot-datadog-snapshot that allows you to query the Datadog API and display graphs of your system right in the chat room. There's not a lot of magic going on there but it's already proven to be real useful. There's certainly still some cleanup that can be done in there, and more tests that need to be written, but I wanted to get something out there for others to check out.
Script in Action
There's documentation on the npm page and in the GitHub repository that goes into how to get started, so instead of repeating that documentation here let's take a quick look at the script in action.
Preparing a Query
The easiest way to get started with a query is to design it right in Datadog itself. Once you have something you like, click on the JSON tab which will expose the raw query under the q property:
{<1>}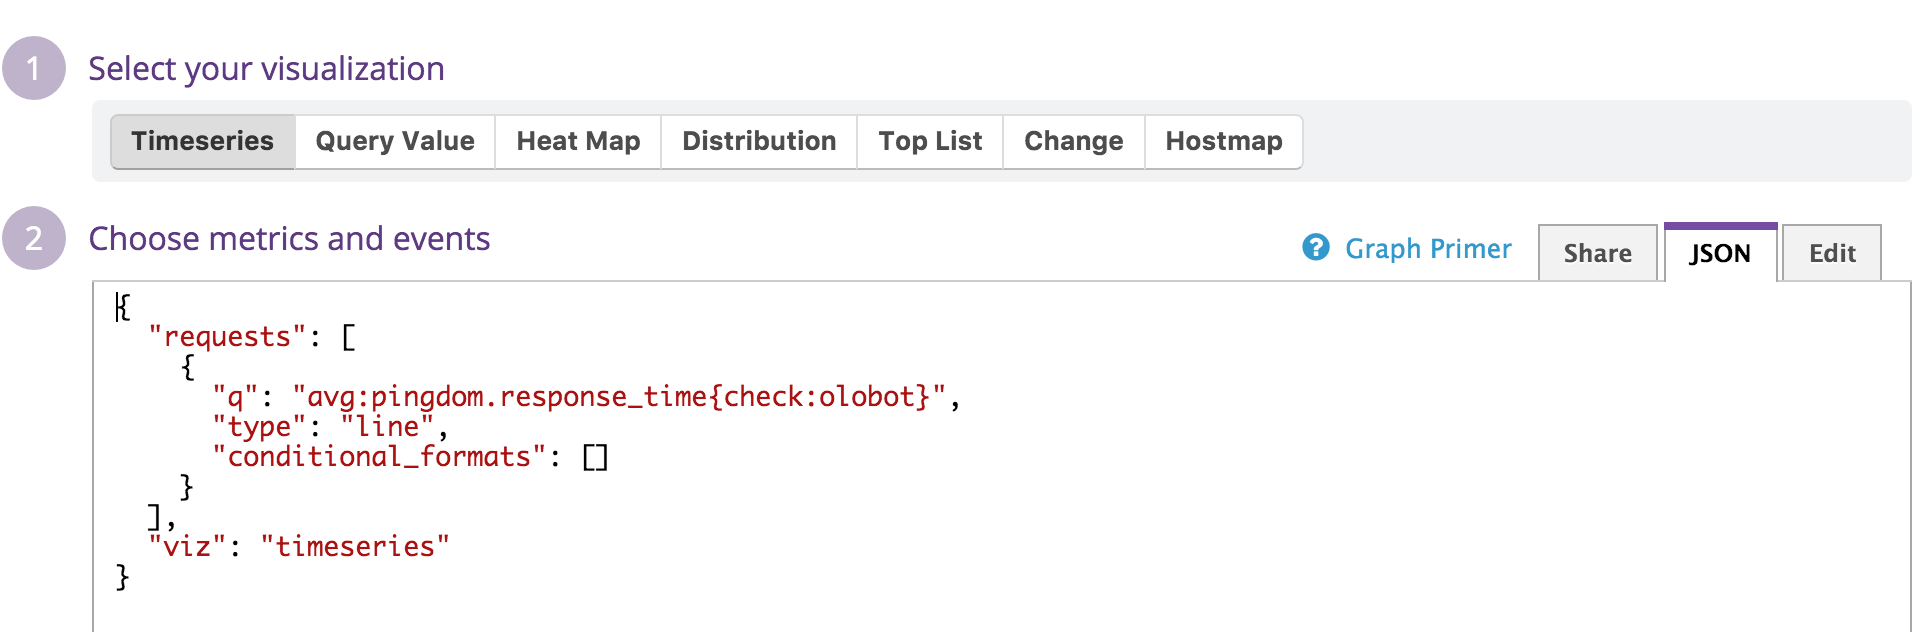
Querying Datadog
The query command allows you to take that query and pull a graph based on it. You can also optionally specify a time period to graph, which can be defined in seconds, minutes, hours, and days.
For example, we have our Pingdom checks reporting into Datadog, so let's query the response times for our Hubot instance over the last 30 minutes:
{<2>}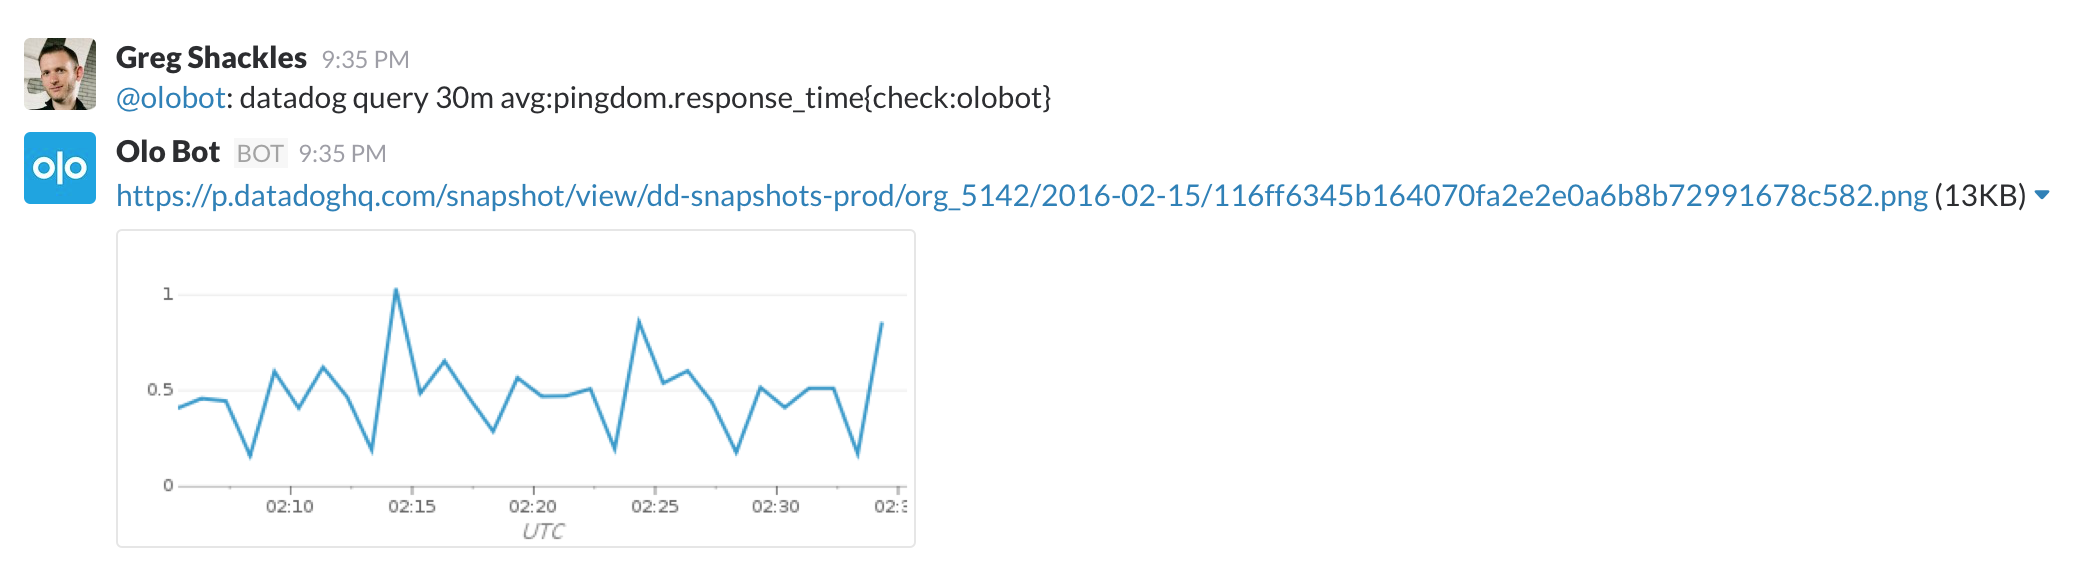
If you leave out the time period it will default to an hour.
Saving Queries For Later
Datadog's query syntax is pretty easy, but it's also easier when you have their autocomplete helping you out, and it definitely would discourage using this tool if you had to type all of that in every time. To avoid this issue, the script also allows you to save your last query as part of the conversation:
{<3>}
As seen here you can also use the shorthand dd instead of datadog to help make it even easier to run these commands.
Working With Saved Queries
It would be silly to make you remember all the saved queries, so the script also provides a command to quickly list them out:
{<4>}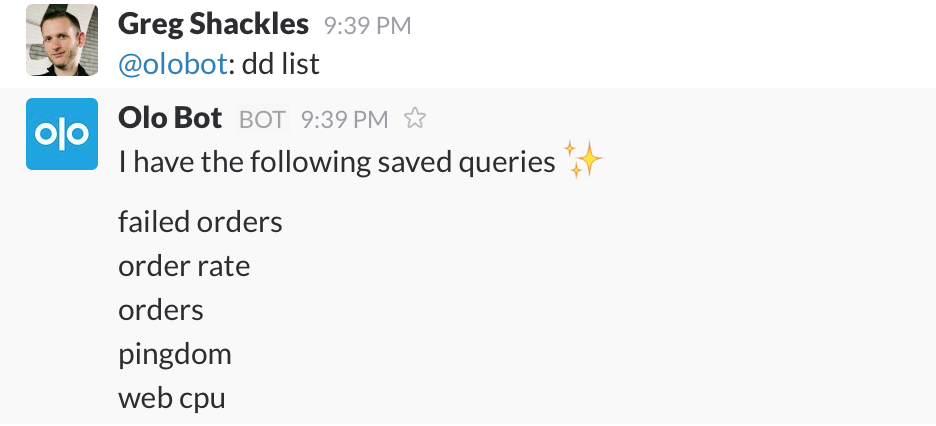
You can use the same query command from earlier to use one of these saved queries:
{<5>}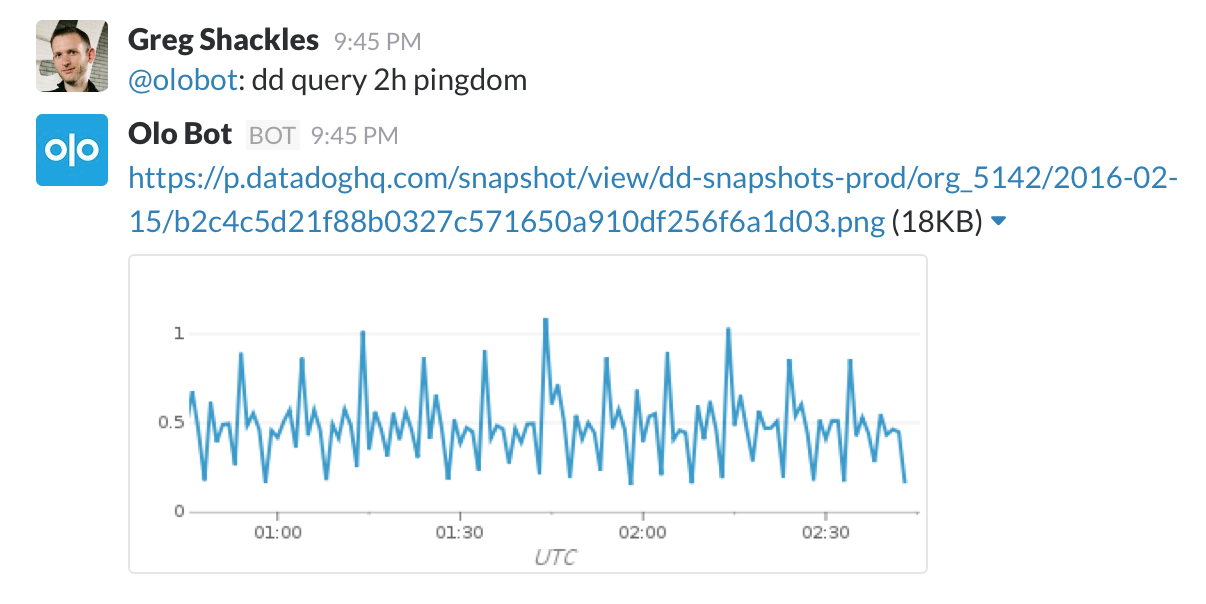
Forget how one of those queries was defined? No problem, the describe command has your back:
{<6>}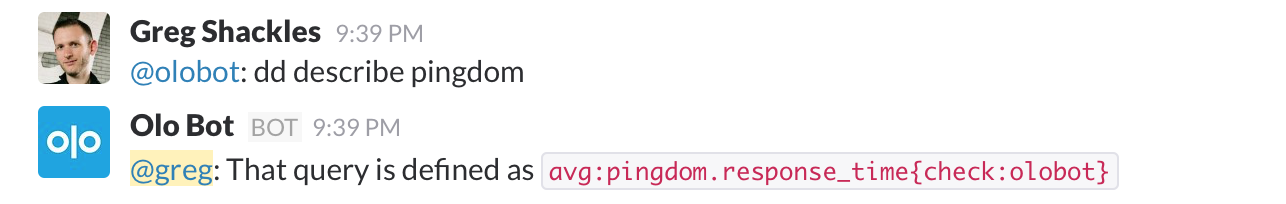
Want to get rid of a query? Just run the delete command:
{<7>}
Summary
There's definitely more I'd like to do with this script but I wanted to get it out there in hopes of others finding it useful, and also hearing what others might want to see from it. I also really hope Datadog extends their snapshot API to allow for being able to pull some of the other types of awesome graphs they expose in their dashboards.
There are a few other Datadog scripts I've seen that do similar things, but I really wanted one focused on saving reusable queries, and also was a bit more conversational in nature. If you find this useful please do let me know, and if you haven't played with Datadog yet, do yourself a favor and check it out!